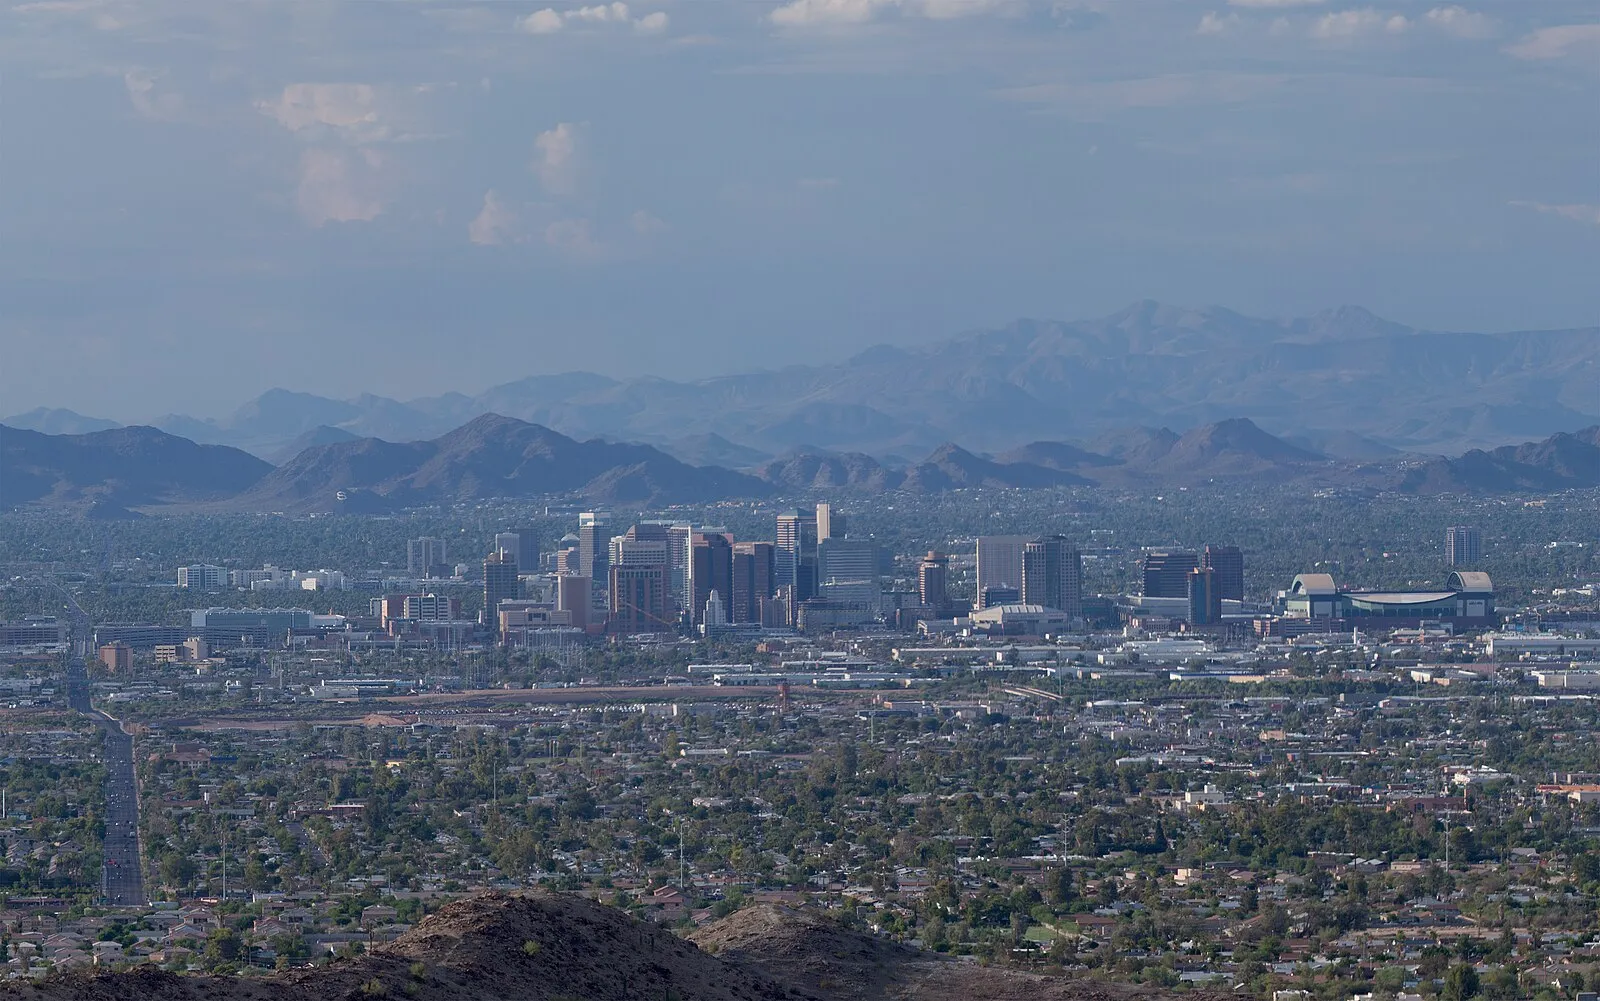
Cost of Living inPhoenix, AZ, United States
Image credit: DPPed
Purchasing Power vs. United States
Based on GDP per capita (PPP). United States: $75,489/capita.
How Far Your Money Goes
Prices are 26% lower than the global benchmark (New York City = 100).
Income Category
Happiness
6.7 / 10
#22 globally
GDP per Capita
City Population
Monthly Costs
Rent
Food
Transport
Utilities
Education
Child Education
Public-school quality + expat access, alongside international and private school cost — the two paths a relocating family weighs.
Public schools
Public-schooling rules are set nationally for United States; Phoenix, AZ-specific enrollment notes are still being verified.
Quality
Mixed public-school option
Expat access
Available to residents
conditionalInstruction
English
Language fit is more manageable.
PISA / outcomes
Qualitative only
Using curated quality notes for now.
Why this quality rating
The United States has many excellent public schools, but quality varies sharply by district and neighborhood.
Why the expat-access rating looks like this
Resident families can use local public schools, but school quality depends heavily on district assignment and housing location.
🗺️ Homeschooling
Varies by stateHomeschooling is legal in all 50 US states but regulations vary dramatically. Some states (TX, AK, ID) have minimal oversight; others (NY, PA, MA) require notification, testing, and curriculum approval. Most worldschooling families establish residency in low-regulation states.
Homeschool legality in United States — check current regulations before committing.
Source: User-curated family relocation research (initial seed) (2026-04-14)
International & private schools
Childcare & Domestic Help
Current nanny and household-help pricing snapshot for Phoenix, AZ, United States.
Full-time nanny (5 days)
$2,650-$3,400
monthly · confidence 0.65
Live-in / 24-7 nanny
$3,200-$4,100
monthly · confidence 0.65
Source: curated family relocation research
Getting Around
The concrete mobility picture for Phoenix: airport access, urban transit, and rideshare practicality.
Airport
Major desert-Southwest air hub
Phoenix Sky Harbor gives the metro one of the stronger domestic route maps in the Southwest plus practical Mexico and long-haul family connectivity.
Urban transit
Light rail and bus
Valley Metro light rail and buses create a real core-city transit spine, but most family movement across the wider metro still remains road-led.
Rideshare
Uber and Lyft available
Ride-hailing is a standard complement for airport runs, summer-heat convenience, and suburb-to-suburb trips beyond the rail corridor.
Source: User-curated family relocation research (initial seed) (2026-04-14)
Healthcare
System strength, outcome signals, facility coverage, and self-pay visibility in United States.
Method: country metrics come from public system indicators, facility coverage reflects mapped providers we can inventory, direct pricing only reflects observed self-pay pages, and relative care cost can fall back to broad cost-of-living healthcare indices. Sparse pricing does not imply sparse healthcare availability.
Healthcare system
StrongHigh national coverage, strong doctor availability, and deep nursing capacity support this rating.
Public care
GoodBroad public coverage, relatively low patient cost-sharing, and country-level outcomes are comparatively strong support this rating.
Private care
GoodA meaningful tracked hospital and clinic network and a clearly private facility base help, but self-pay pricing transparency is still sparse.
UHC coverage
88/100
2023
Physicians
3.68/1k
2022
Hospital beds
2.68/1k
2022
Out of pocket
11%
2023
Outcome signals
Life expectancy
78.9 yrs
2024
Maternal mortality
17/100k
2023
Neonatal mortality
3.7/1k
2024
International patient readiness
GoodA visible private hospital base and multiple facilities have websites help, but price transparency is still sparse.
Pricing transparency
LimitedMultiple facilities have crawlable websites help, but published self-pay prices are scarce.
Facility coverage
Self-pay pricing visibility
No verified self-pay prices are published for the tracked facilities in United States yet.
This usually reflects low online price transparency rather than a lack of healthcare providers.
Notable facilities
System metrics: World Bank WDI · Updated 2026-07-01
Safety & Governance
Street Safety
Source: Numbeo where a city row is matched; otherwise World Bank WGI and country-level safety context.
Political Stability
World Bank WGI scale: -2.5 to +2.5.
Wages by Sector
| Sector | Median |
|---|---|
| Information & Technology | $166,335/yr |
| Finance & Insurance | $132,814/yr |
| Professional & Scientific Services | $128,248/yr |
| Utilities | $123,774/yr |
| Manufacturing | $108,333/yr |
| Transport & Logistics | $102,055/yr |
| Mining & Quarrying | $100,170/yr |
| Healthcare & Social Work | $84,518/yr |
| Real Estate | $83,510/yr |
| Other Services | $82,402/yr |
| Retail & Wholesale Trade | $80,013/yr |
| Education | $79,973/yr |
| Construction | $77,040/yr |
| Arts, Entertainment & Recreation | $76,405/yr |
| Administrative & Support Services | $70,660/yr |
| Agriculture & Farming | $53,053/yr |
| Hospitality & Food Service | $41,876/yr |
2025 annual wages in Phoenix, AZ, United States · Source: BLS OEWS (MSA-adjusted)
Price Comparison vs. US
Visa Information (US passport)
Long-Term Visa Programs
investment
US EB-5 Immigrant Investor (Standard)Quick comparison FAQ
Structured from the deltas already shown on this page — no invented facts, no extra data sources.
How far does your money go in Phoenix compared with the US?
Your money goes about 1.1x further in Phoenix than in the US, based on the current PPP estimate.
Is Phoenix cheaper or more expensive overall than New York City?
Phoenix is cheaper overall than New York City — overall living costs are about 26% cheaper than the global benchmark (New York City) for Phoenix.
How does rent in Phoenix compare with New York City?
Rent in Phoenix is about 62% cheaper than the global benchmark (New York City).
How expensive are groceries and restaurants in Phoenix?
Groceries in Phoenix are about 21% cheaper than the global benchmark (New York City), and restaurant prices are about 21% cheaper than the same benchmark.
About Phoenix, AZ
Phoenix is the capital of Arizona and the fifth-most-populous city in the United States, with about 1.65 million residents in the city proper and over five million in the surrounding Valley of the Sun. It sits in the northern Sonoran Desert at roughly 340 meters elevation and has been one of the country's fastest-growing metros for two decades, driven by semiconductor investment, healthcare, and aerospace. For relocators the math has shifted: housing costs jumped sharply during the pandemic but remain below coastal California, state income tax is low, and the airport hub is genuinely useful. The defining trade-off is climate — summer highs regularly exceed 110°F for weeks, water supply from the Colorado River is under structural pressure, and a car is effectively required outside a few central districts.
See the full breakdown — free
No password needed. Takes ~30 seconds.
More cities in United States
Cities with a similar cost of living
Comparable to Phoenix — worth a look if you're weighing alternatives.